2012-06-04 58 views
10

我正在尋找有關在笛卡爾平面中繪製矢量的建議。任務是繪製點(座標),然後用箭頭將它們鏈接到某個源點(比如0,0)。下面的圖片應該給出一個想法。我不關心顏色和命名矢量/點,只是在座標平面上繪製箭頭。我相信一些庫存在於R(或python)中,用於繪製線性代數向量和操作。使用R或python在座標系中繪製矢量

任何指針,將不勝感激!

vectors in a plane http://mathinsight.org/media/image/image/vector_2d_add.png

+9

「的指針,將不勝感激」 *呻吟* – Spacedman

回答

13

或者你可以使用arrows功能R.

plot(c(0,1),c(0,1)) 
arrows(0,0,1,1) 
+0

有趣。是否可以在箭頭上添加一些眼睛糖果? (厚度,顏色,箭頭樣式,短劃線......) – heltonbiker

+1

@heltonbiker請參閱'?箭頭'。它說'col','lty'和'lwd'被接受。 – Gregor

+0

另外,如果你想在你的標籤中看中,請查看tikzDevice包。 – Gregor

0

作用最明顯的當然是使用python的matplotlib包,裏面有很多的繪圖功能。

具體而言,您想反向工程this example

以更藝術和更笛卡爾的方式獲得好結果的另一種方法是使用rsvg創建和呈現SVG。我從來沒有嘗試過,但SVG應該有箭頭的本機支持。另外,如果需要,可以在Inkscape等繪圖程序中編輯SVG文件。

10
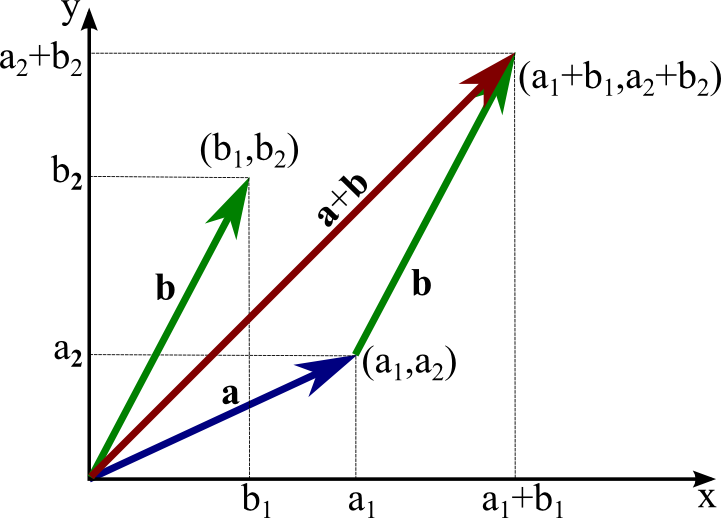
plot(NA, xlim=c(0,5), ylim=c(0,5), xlab="X", ylab="Y") 
vecs <- data.frame(vname=c("a","b","a+b", "transb"), 
        x0=c(0,0,0,2),y0=c(0,0,0,1), x1=c(2,1,3,3) ,y1=c(1,2,3,3), 
        col=1:4) 
with(vecs, mapply("arrows", x0, y0, x1,y1,col=col)) 

它看起來好一點,如果你添加LWD = 3到arrows通話。 text函數將允許標記,並可以使用'srt'參數進行旋轉。

plot(NA, xlim=c(0,5), ylim=c(0,5), xlab="X", ylab="Y", lwd=3) 
with(vecs, mapply("arrows", x0, y0, x1,y1,col=col,lwd=3)) 
with(vecs, mapply('text', x=x1[1:3]-.1, y=y1[1:3]+.1, 
    labels=expression(list(a[1],a[2]), list(b[1],b[2]), list(a[1]+b[1],a[2]+b[2])))) 

enter image description here

請注意:expression調用內部的list功能是plotmath list -call,比普通[R list不同,就像plotmath- paste比普通paste不同。它不會嘗試在父框架中評估它的參數。對於那個將需要bquotesubstitute,並可能需要使用sapply用於處理「內部」表達式。

+0

謝謝,那就是我一直在尋找的! – sim

+0

我想加入表達載體的標記方法將是有用的。檢出?plotmath,你應該知道''list'函數與R'list'函數不一樣。對於主要的「粘貼」功能,「貼圖」功能也是如此。 plotmath'list'將表達式內的逗號變爲文字逗號,而不是語法操作。 –

1

一種簡單的方法來繪製幾個隨機大小2向量。我首先計算歐幾里得範數,否則箭頭函數將繪製箭頭從點到點創建一個三角形,作爲解釋很好,但不是我們想要的。其餘部分很簡單:

#first some vectors 
v1<-c(-3,5) 
v2<-c(2,-10) 
v3 <-c(0,-3) 
v4 <- c(2,5) 
# This one for the coordinates of the plot 
ax<-c(-10,10) 
# I will need the euclidean norm (two-norm) of the vectors: 
mag <- function(x) sqrt(sum(x^2)) 
# I call plot to set up the "canvas" 
plot(ax,ax,main="Test") 
# I do the stuffz, the FIRST pair of params is the ORIGIN 
arrows(0,0, mag(v1),mag(v2),lwd=4,col="red") 
arrows(-2,1, mag(v3),mag(v4),lwd=4,col="blue")