1
我想識別圖像中的紅色,然後將該值與另一圖像中的紅色進行比較。我對Matlab很陌生,沒有圖像處理知識。不過,我一直在嘗試一些隨機技術來做到這一點。到目前爲止,我已經使用了單個圖像的RGB通道的直方圖,並且還比較了單個圖像中RGB通道的平均數值。不幸的是,在這兩種情況下我看到幾乎相似的結果,並且不能識別紅色較少和紅色圖像之間的差異。識別圖像中的紅色,然後使用Matlab與其他圖像進行比較
我隨機嘗試使用灰度直方圖,但發現它沒用。
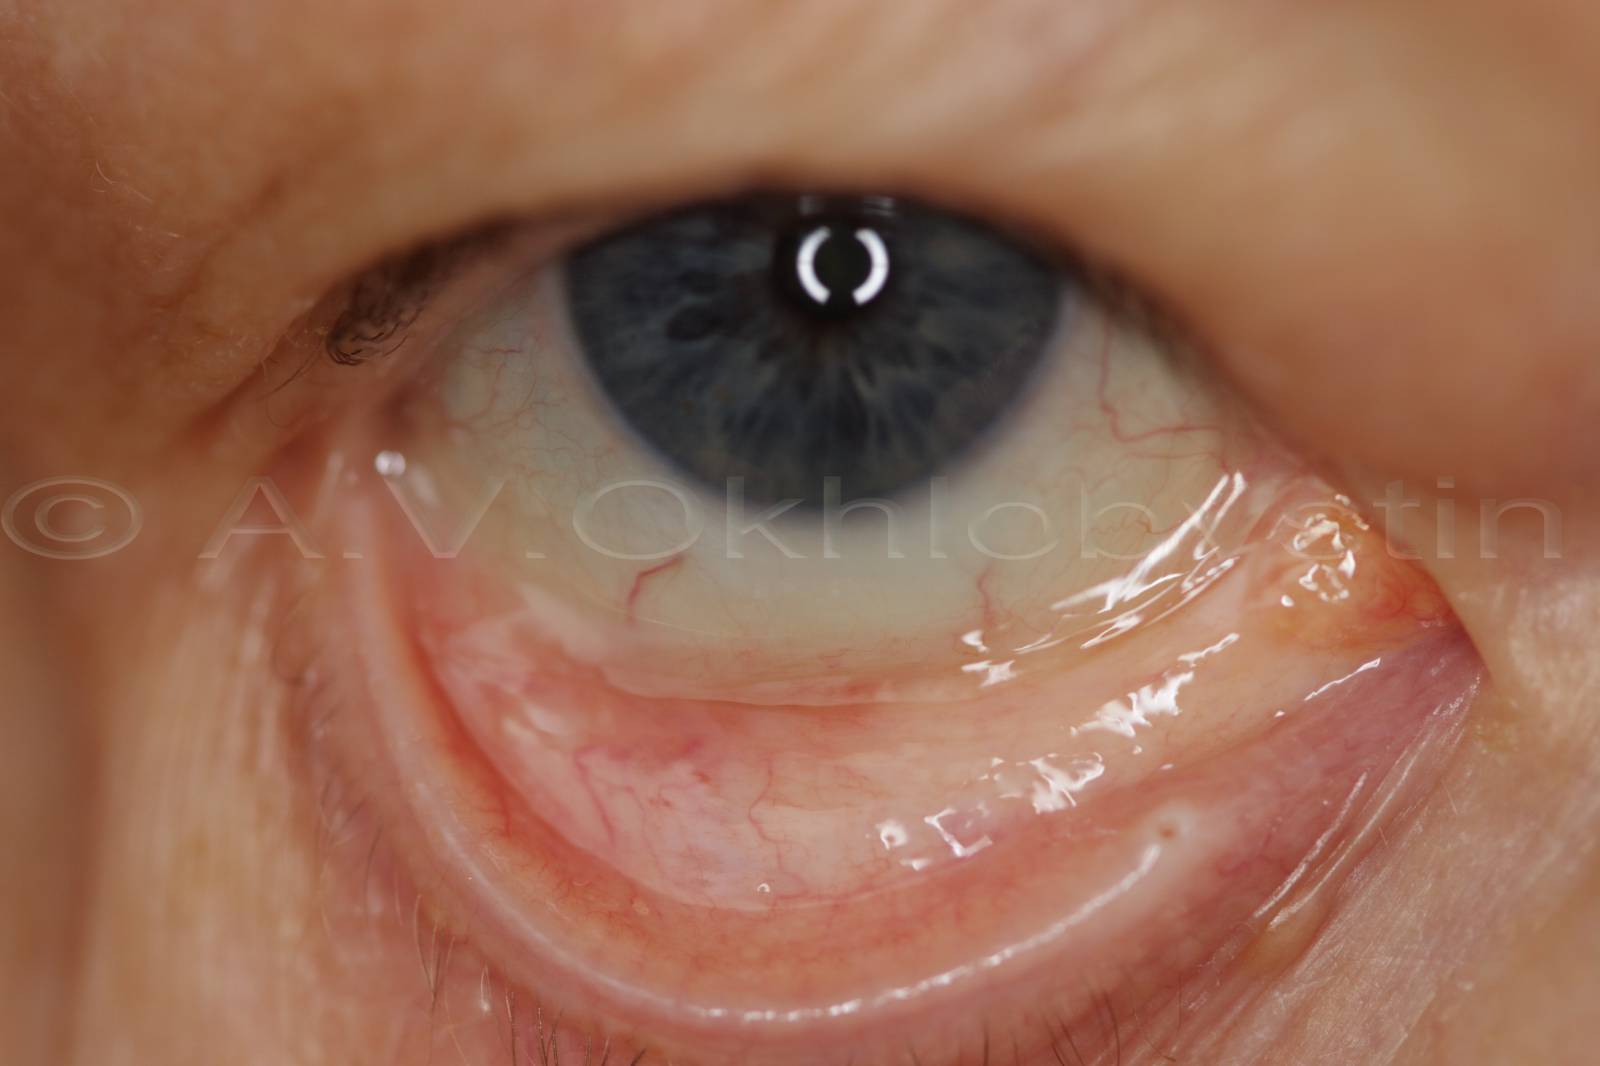
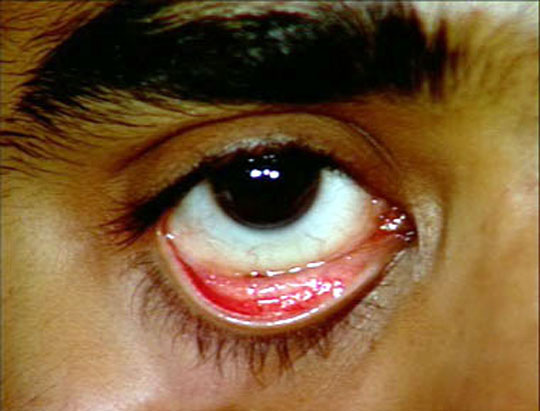
http://proped.ucoz.ru/_ph/5/140053931.jpghttp://www.meddean.luc.edu/lumen/meded/mech/cases/case7/conjunct.jpg
附:我在這個論壇上搜索並試圖找到類似的問題,但我沒有找到任何可以幫助我的東西。 我需要的是: a。哪種技術可以用來檢查圖像中的紅色? b。 Matlab如何幫助我?
%-------------------------------------------
%For histograms of all 3 RGB channels in an image

i = imread('<Path>\a7.png');
imgr = i(:,:,1);
imgg = i(:,:,2);
imgb = i(:,:,3);
histr = hist(imgr(:), bins);
histg = hist(imgg(:), bins);
histb = hist(imgb(:), bins);
hfinal = [histr(:); histg(:); histb(:)];
plot(bins, histr);


%-------------------------------------------
%To compare mean values of R channels of all images

clear all;
%read all images in a sequence
flist=dir('<Path>\*.png');

for p = 1:length(flist)
    for q = 1 : 3
    fread = strcat('<Path>\',flist(p).name);
    im = imread(fread);
    meanim(p,q) = mean2(im(:,:,q));
    end
end

%disp(meanim);
rm = meanim(:,1);
frm = sum(rm(:));
gm = meanim(:,2);
fgm = sum(gm(:));
bm = meanim(:,3);
fbm = sum(bm(:));

figure();
set(0,'DefaultAxesColorOrder',[1 0 0;0 1 0;0 0 1]);
pall = [rm(:), gm(:), bm(:)];
plot(pall);
title('Mean values of R, G and B in 12 images');
leg1 = legend('Red','Green','Blue', ...
       'Location','Best');
print (gcf, '-dbmp', 'rgbchannels.bmp')

sm = sum(meanim);
fsum = sum(sm(:));

% disp(fsum);

f2 = figure(2);
set(f2, 'Name','Average Values');
t = uitable('Parent', f2, 'Position', [20 20 520 380]);
set(t, 'ColumnName', {'Average R', 'Average G', 'Average B'});
set(t, 'Data', pall);
print (gcf, '-dbmp', 'rgbtable.bmp') ;

rgbratio = rm ./ fsum;
disp(rgbratio);

f3 = figure(3);
aind = 1:6;
hold on;
subplot(1,2,1);
plot(rgbratio(aind),'r+');
title('Plot of anemic images - having more pallor');

nind = 7:12;
subplot(1,2,2);
plot(rgbratio(nind),'b.');
title('Plot of non anemic images - having less pallor');
hold off;
print (gcf, '-dbmp', 'anemicpics.bmp');
謝謝大衛。這裏是兩個鏈接: http://proped.ucoz.ru/_ph/5/140053931.jpg http://www.meddean.luc.edu/lumen/meded/mech/cases/case7/conjunct.jpg 我只需要結膜(內眼瞼)的裁剪圖像,我沒有使用整個眼睛的圖像。 – Hasan 2014-10-02 01:40:58
你走了。這些照片真的很令人毛骨悚然!我不知道如何裁剪照片,對不起。 – David 2014-10-02 01:48:12
您可能有興趣查看我之前寫過的[搜索隨機圖像中的紅色對象]的一些代碼(http://codegolf.stackexchange.com/a/20033/11006)。經過一些試驗和錯誤,我發現'redness = max(0,r-(max(g,b)+ abs(g-b)))'給出了相當好的結果。 – 2014-10-02 10:20:36